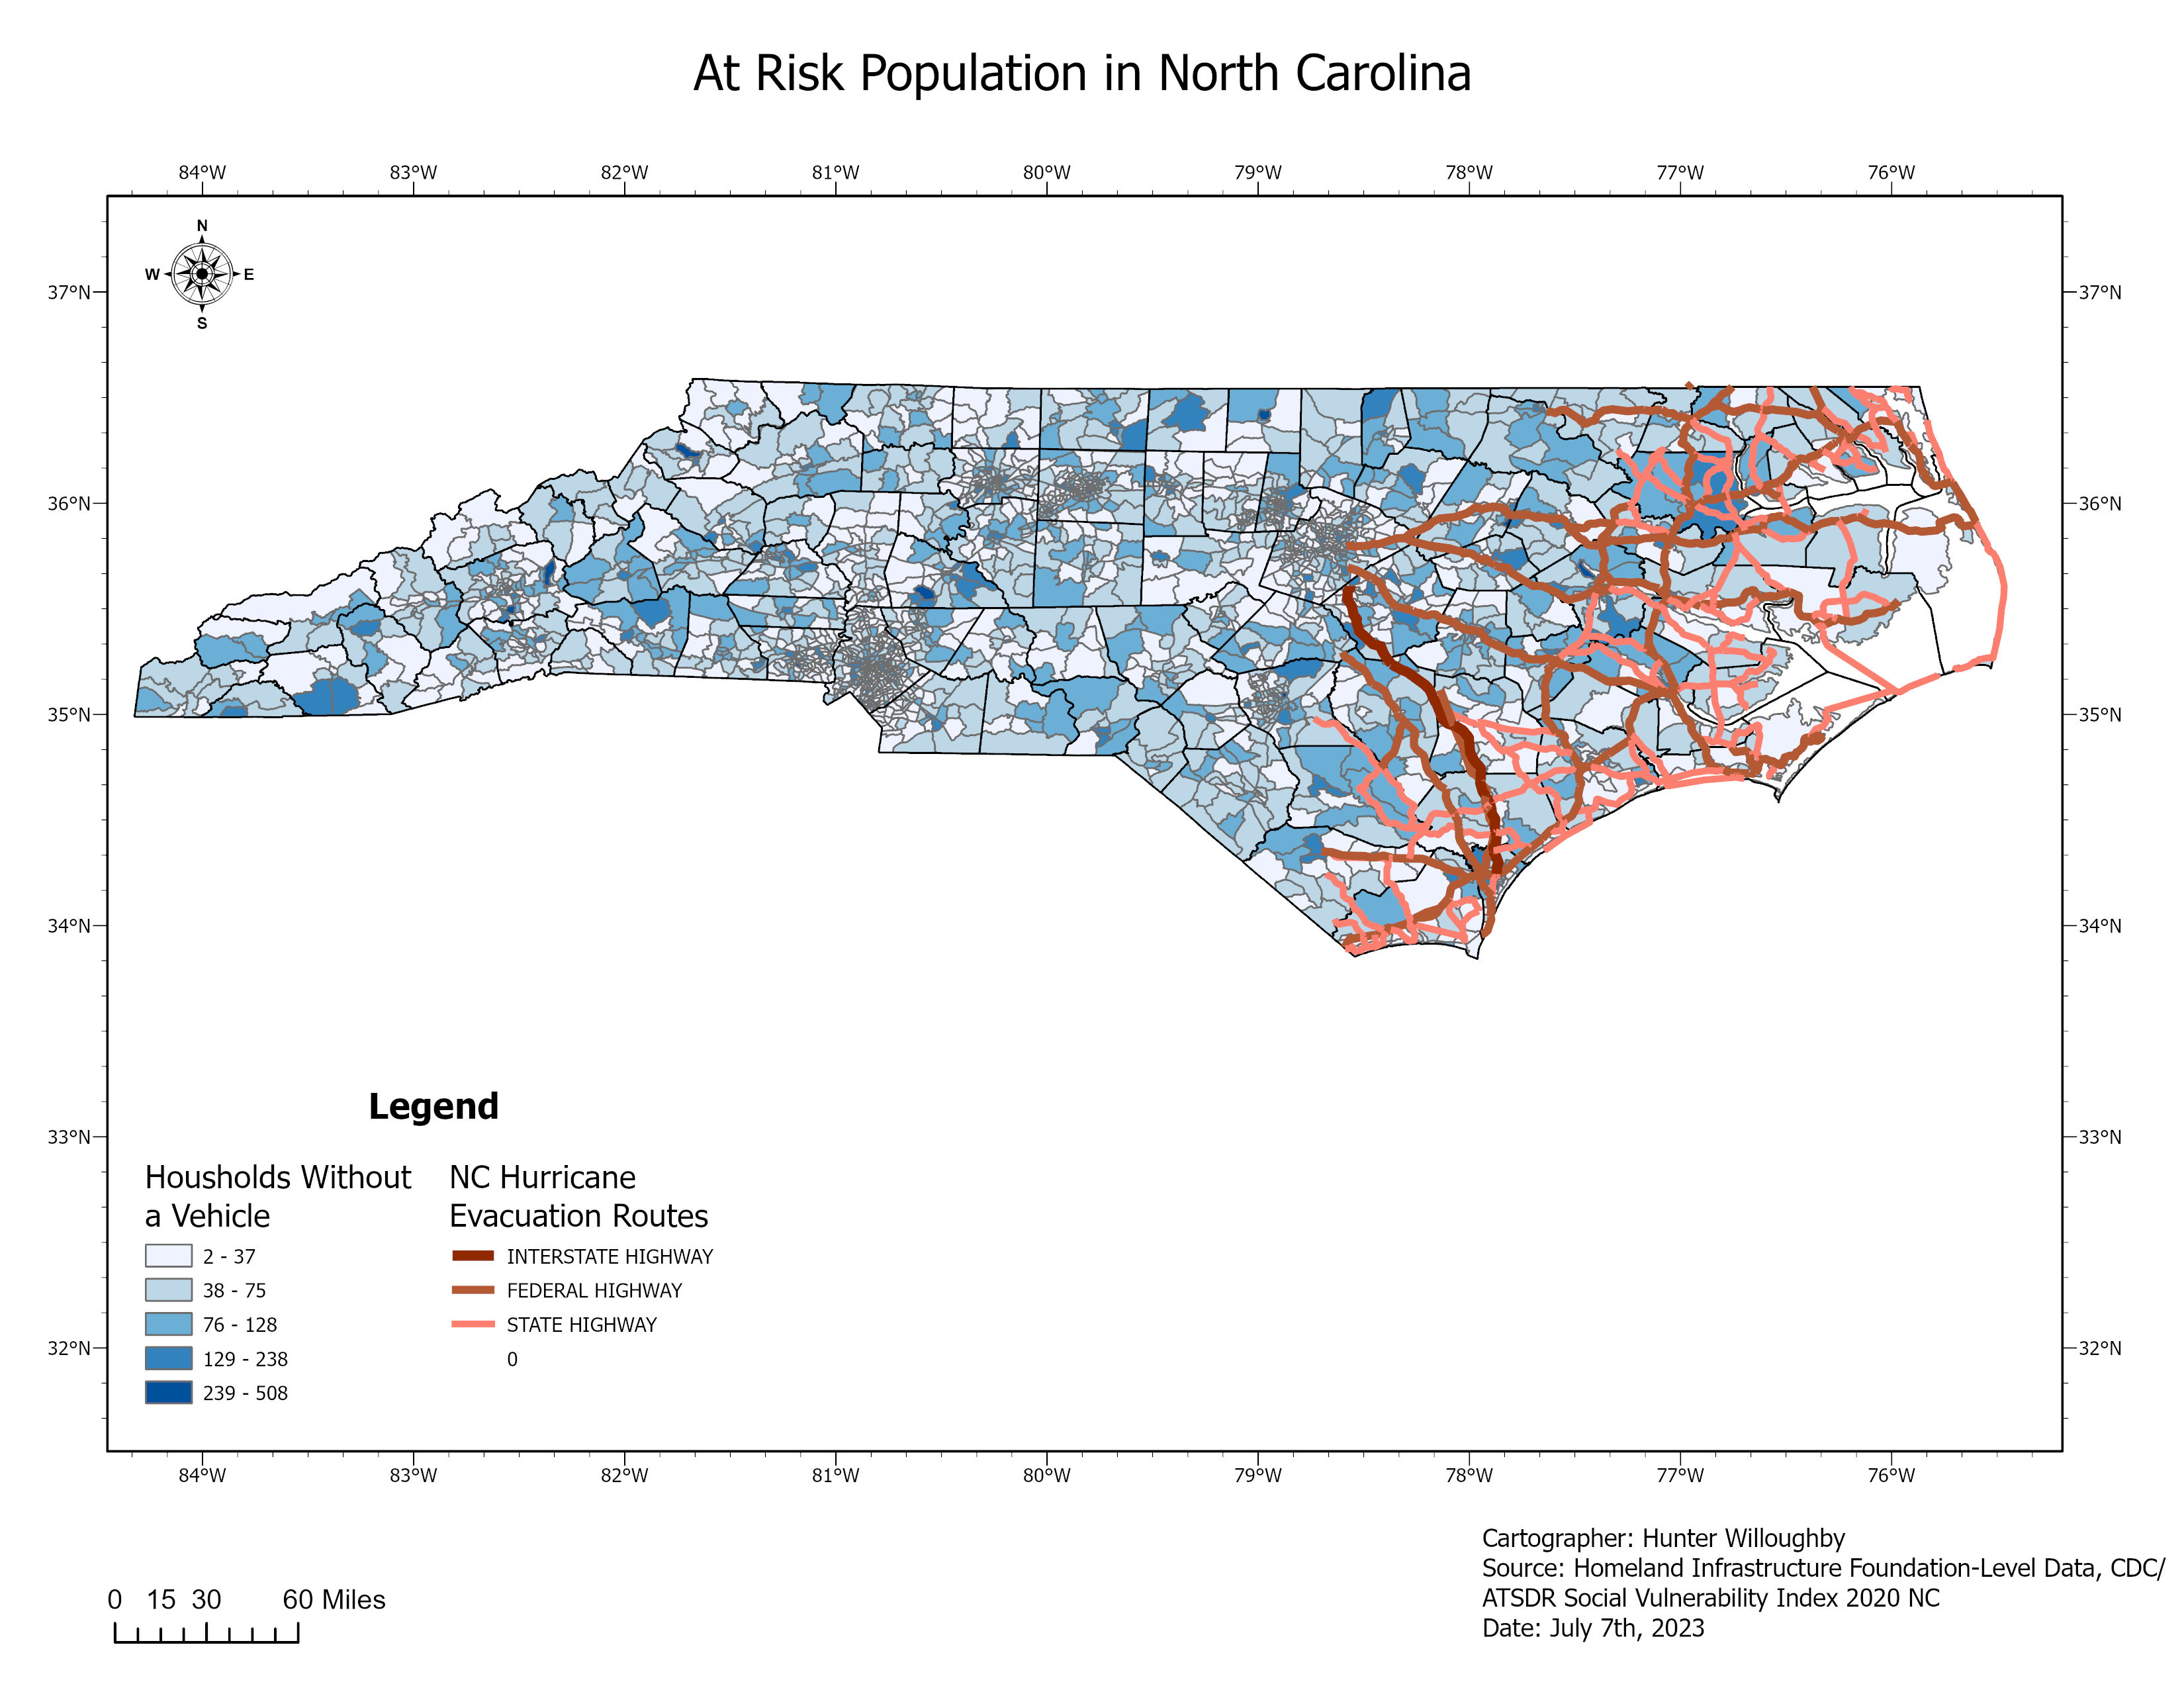
North Carolina At Risk Population
This map displays hurricane evacuation routes and demographic data by census tract gathered in 2020. It highlights households at greater risk during hurricane evacuations due to lack of transportation.
A small sample of maps I have created using ArcGIS.
This map displays hurricane evacuation routes and demographic data by census tract gathered in 2020. It highlights households at greater risk during hurricane evacuations due to lack of transportation.
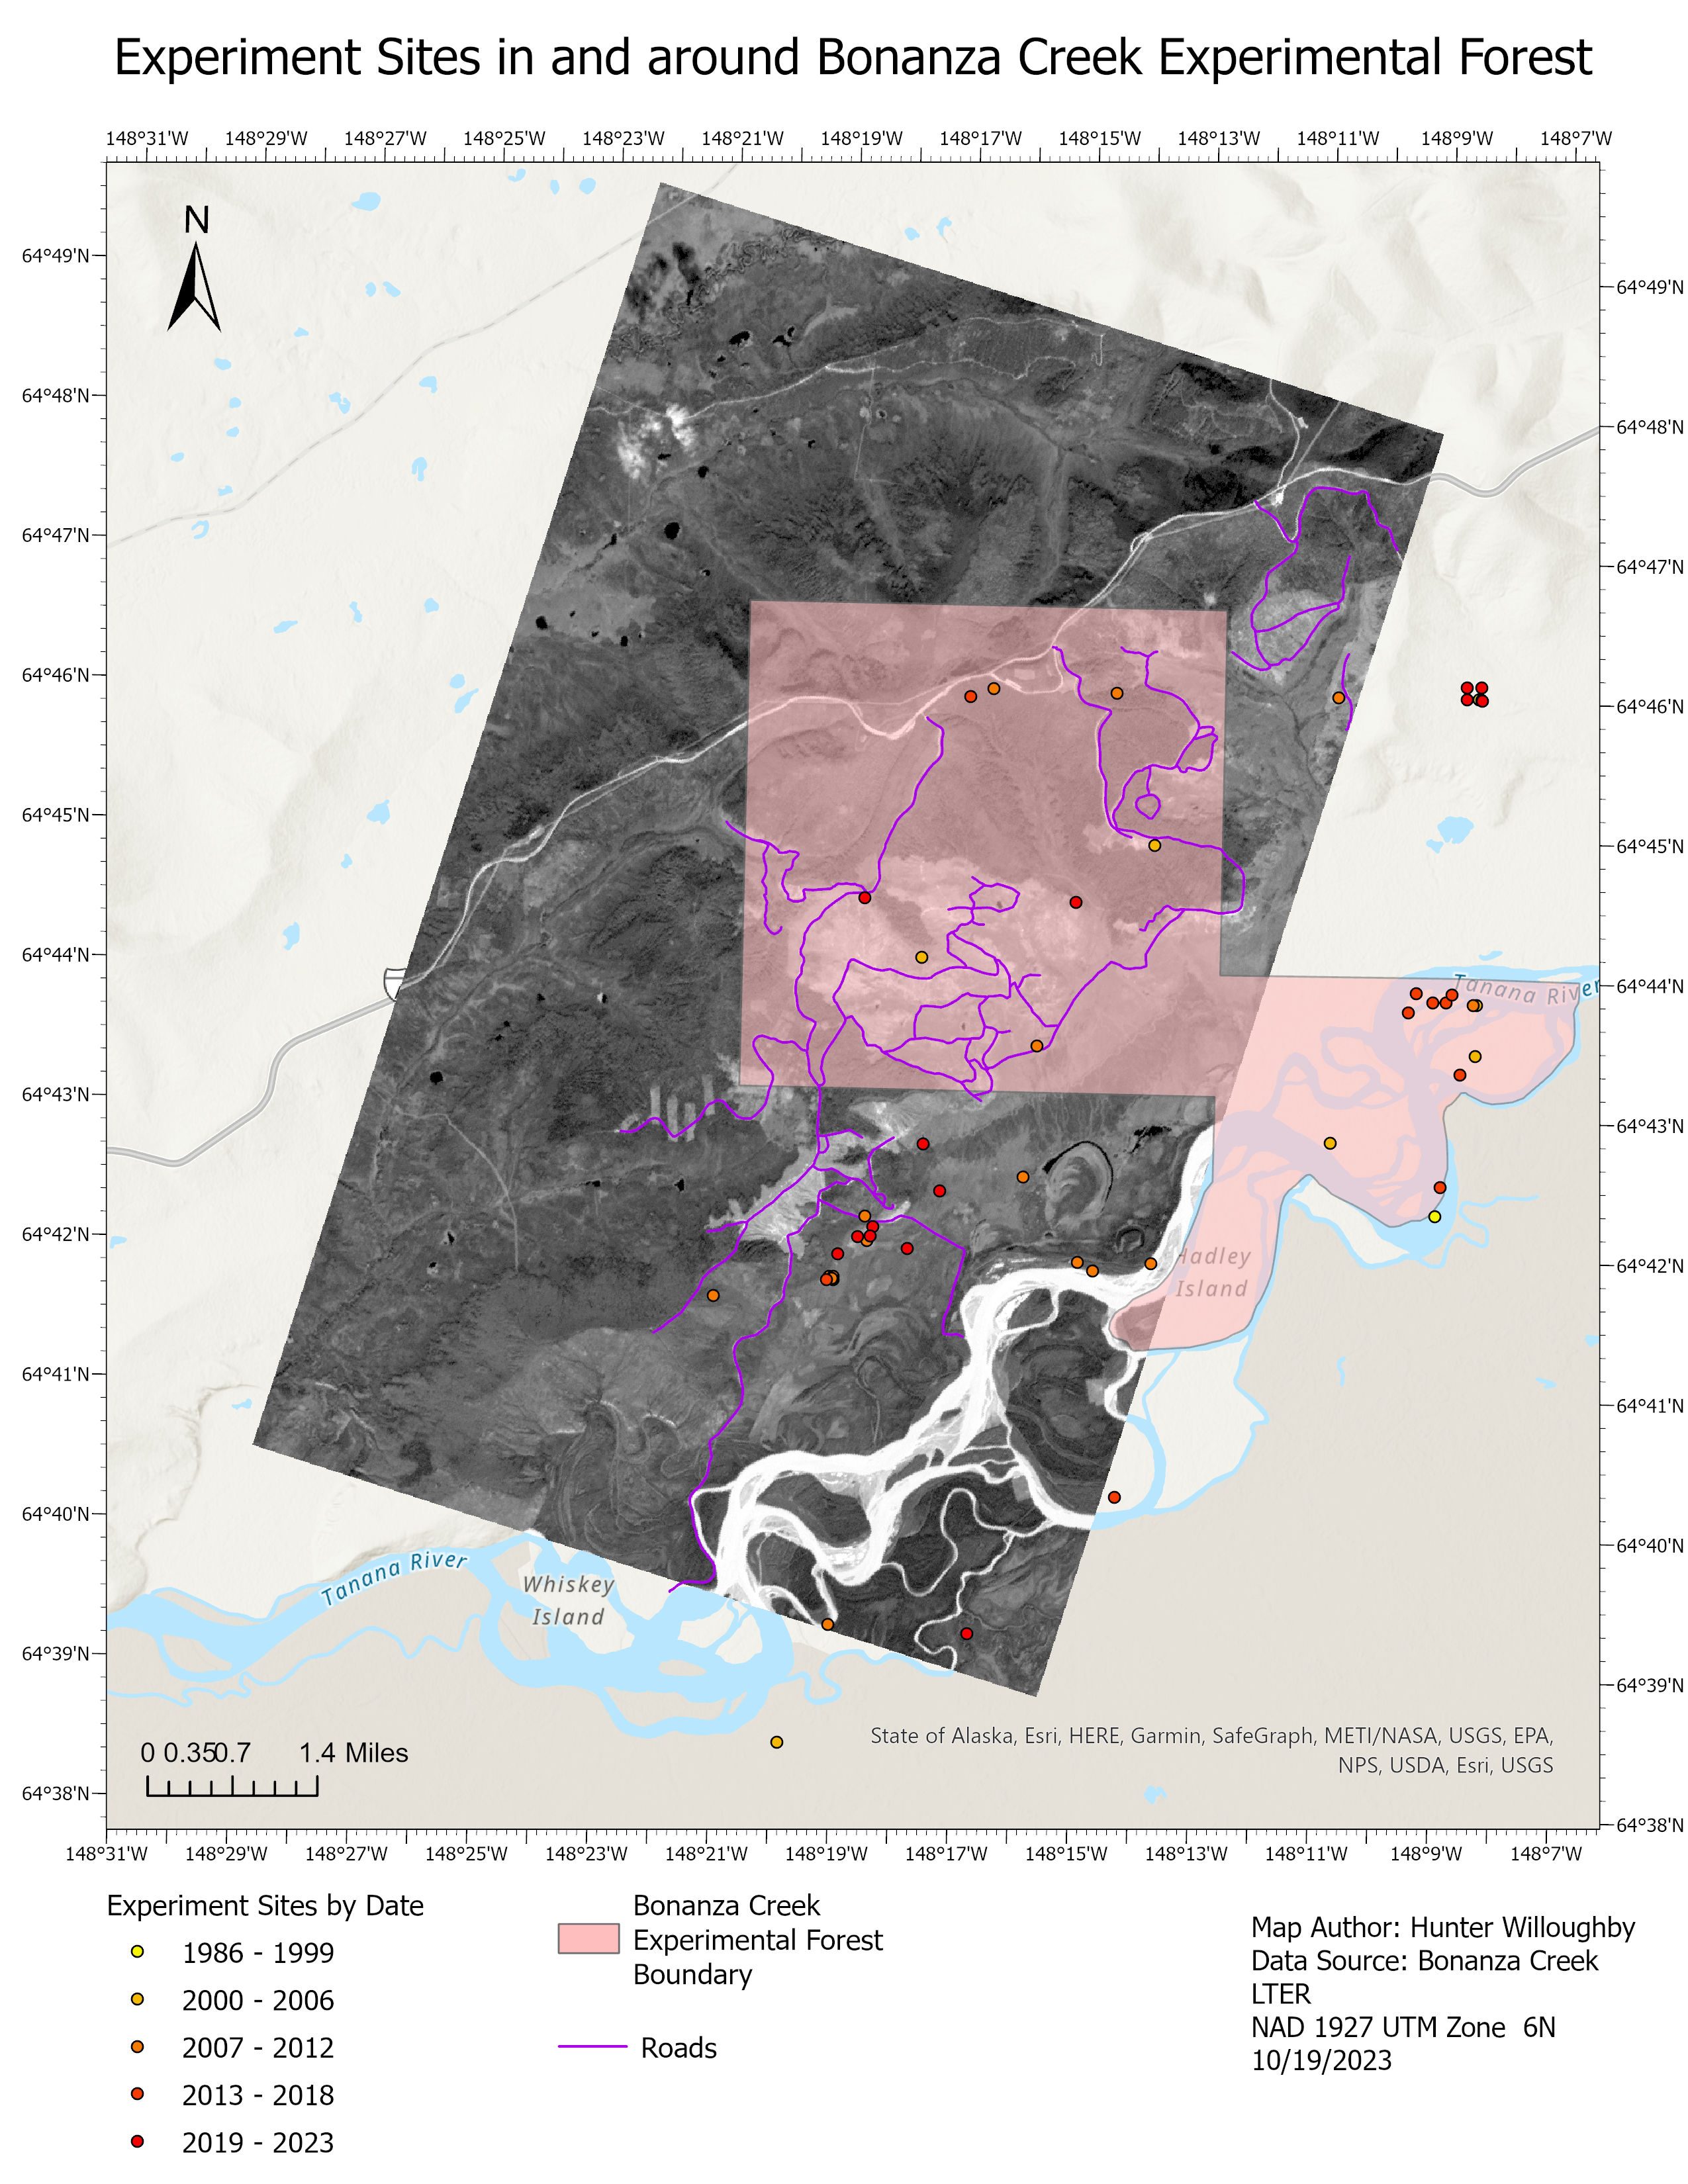
For this map I have converted raw raster data into georeferenced raster data and did an image to map transformation by adding control points covering the extent of the image. After, I edited the boundary layer and added .csv data to represent experiment sites filtered by year to display data from the Bonanza Creek Experimental Forest and projected each file to the NAD 1927 UTM Zone 6N coordinate system.
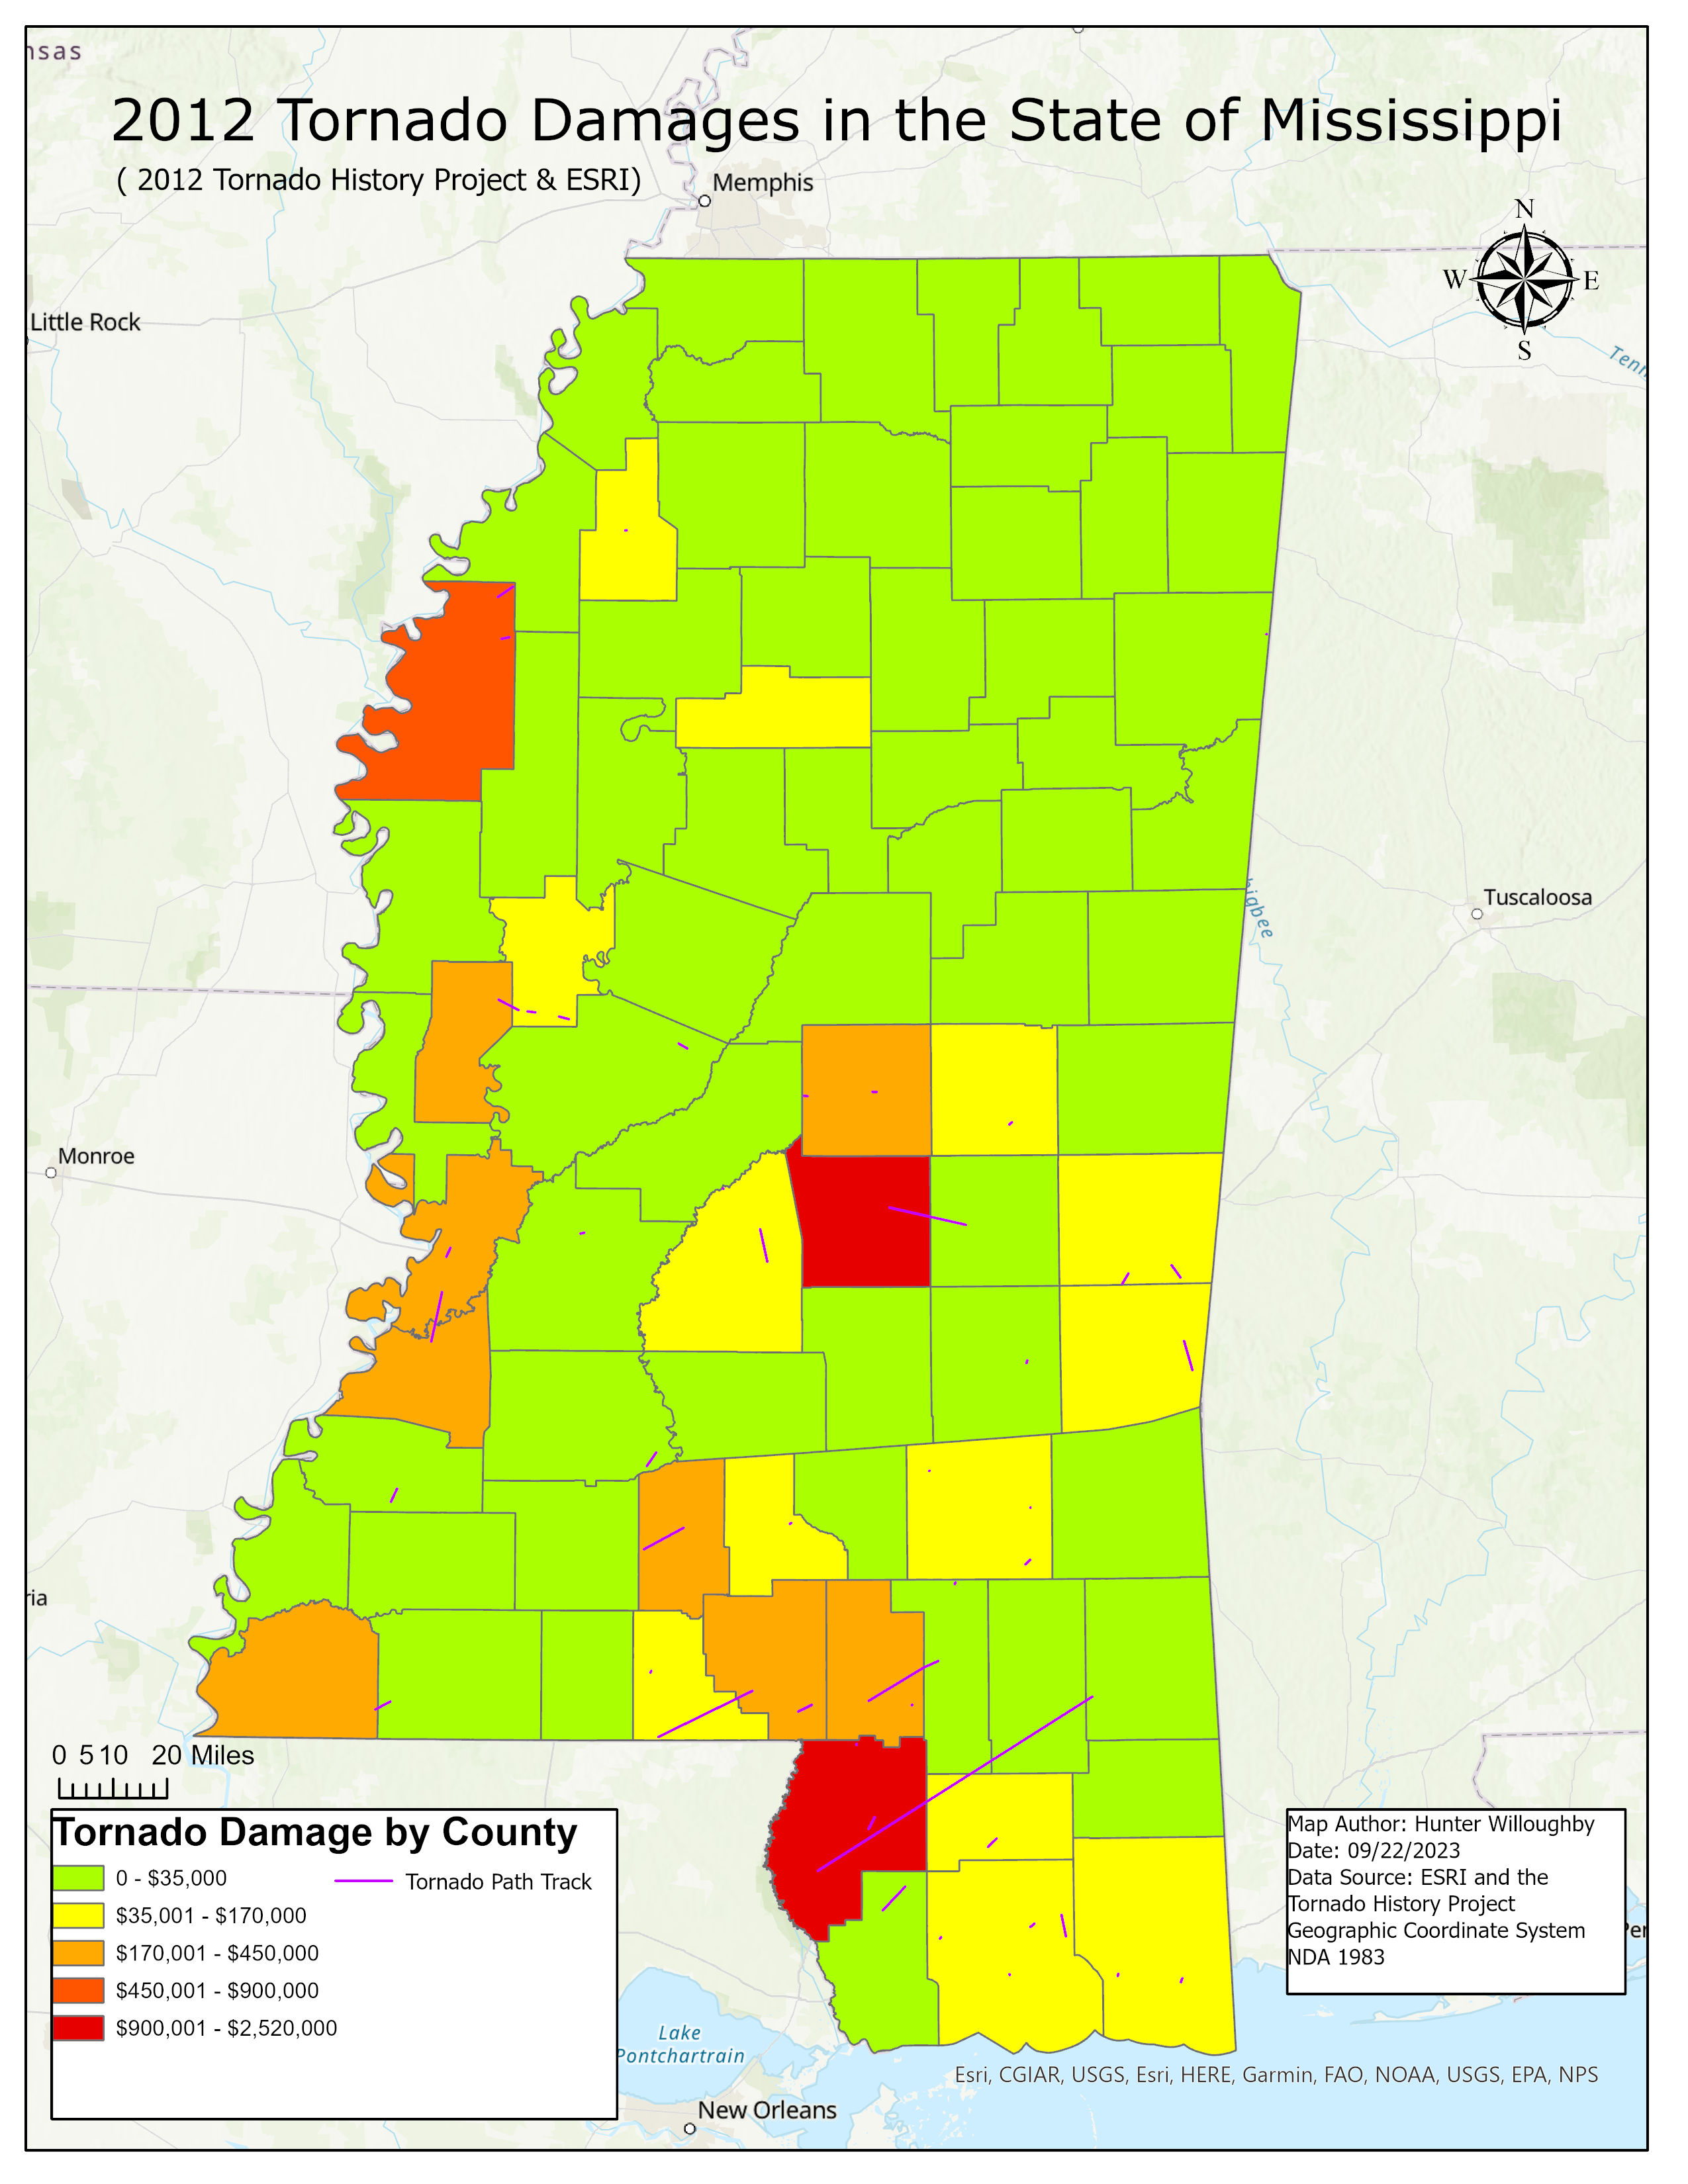
For this map I have added tabular data about tornado damages and joined it with county layers to show tornado damage amounts sustained by each county during 2012. I have also converted point data into line data to represent tornado tracks by utilizing the XY to Line tool in ArcGIS Pro.